The other day at work I wanted to run a quick performance test, but I didn’t want I/O to be a bottleneck. The typical solution here is to use a ramdisk, but in my case, I was dealing with very large files, so a ramdisk wouldn’t be big enough. In fact, I didn’t care about the output at all, so ideally I’d be able to write all output to /dev/null, but that wasn’t possible in this test (for example, the system will automatically append a file extension to your filename).
If I wanted to, I could have made a few code changes to get my test to work properly, but a little googling revealed nullfs, a FUSE file system which is supposed to be a big black hole, and it seemed like the perfect solution to my problem. I quickly found out it wasn’t:
jsaxton@home:~$ dd if=/dev/zero of=/home/jsaxton/code/nullfs/nulldir/nullfile bs=4K count=250000

250000+0 records in

250000+0 records out

1024000000 bytes (1.0 GB) copied, 11.7364 s, 87.3 MB/s
Compare this to the performance of the real /dev/null:
jsaxton@home:~$ dd if=/dev/zero of=/dev/null bs=4K count=250000

250000+0 records in

250000+0 records out

1024000000 bytes (1.0 GB) copied, 0.183725 s, 5.6 GB/s
FUSE lives in user space, so I totally understand that it should be slower than /dev/null, but 87.3 MB/s seems abysmally slow. That’s slower than a hard disk write. A quick look at top made it clear that the CPU wasn’t the bottleneck. What’s going on here?
Profiling dd
Ideally, I could get a picture of what’s going on by simplying running strace -T (gives the wall time of each system call), but for some reason I wasn’t getting accurate timing for reasons I never bothered to investigate. Instead, I decided to take this opportunity to play with gperftools.
There are a couple of reasons I wanted to try out the gperftools CPU profiler:
- It doesn’t really slow your code down in the way that callgrind or even strace will
- It can measure the wall time that has elapsed, whereas pretty much every other profiler gives you just CPU time
It also doesn’t need debugging symbols or anything like that, so I could easily get it to work with dd:
export LD_PRELOAD=/home/jsaxton/Downloads/gperftools-2.1/.libs/libprofiler.so

export CPUPROFILE=/tmp/prof.out

export CPUPROFILE_FREQUENCY=10000

export CPUPROFILE_REALTIME=1

dd if=/dev/zero of=/dev/null bs=4K count=250000
Google doesn’t recommend it, but you can use $LD_PRELOAD to load their profiling library without having to actually link it into dd, so that’s what I did. Since the profiling library is loaded and $CPUPROFILE is set, when you run dd, profiling information will be written to /tmp/prof.out (with some important caveats, discussed later). We’re also specifying a sampling frequency of 10000 samples/sec and telling the profiler to profile what’s happening in real time, not CPU time.
Next, we can run a post processing script to get a nice visualization of the profiling data. There are lots of supported output formats — my favorite is callgrind:
google-pprof --callgrind `which dd` /tmp/prof.out > dev_null.callgrind
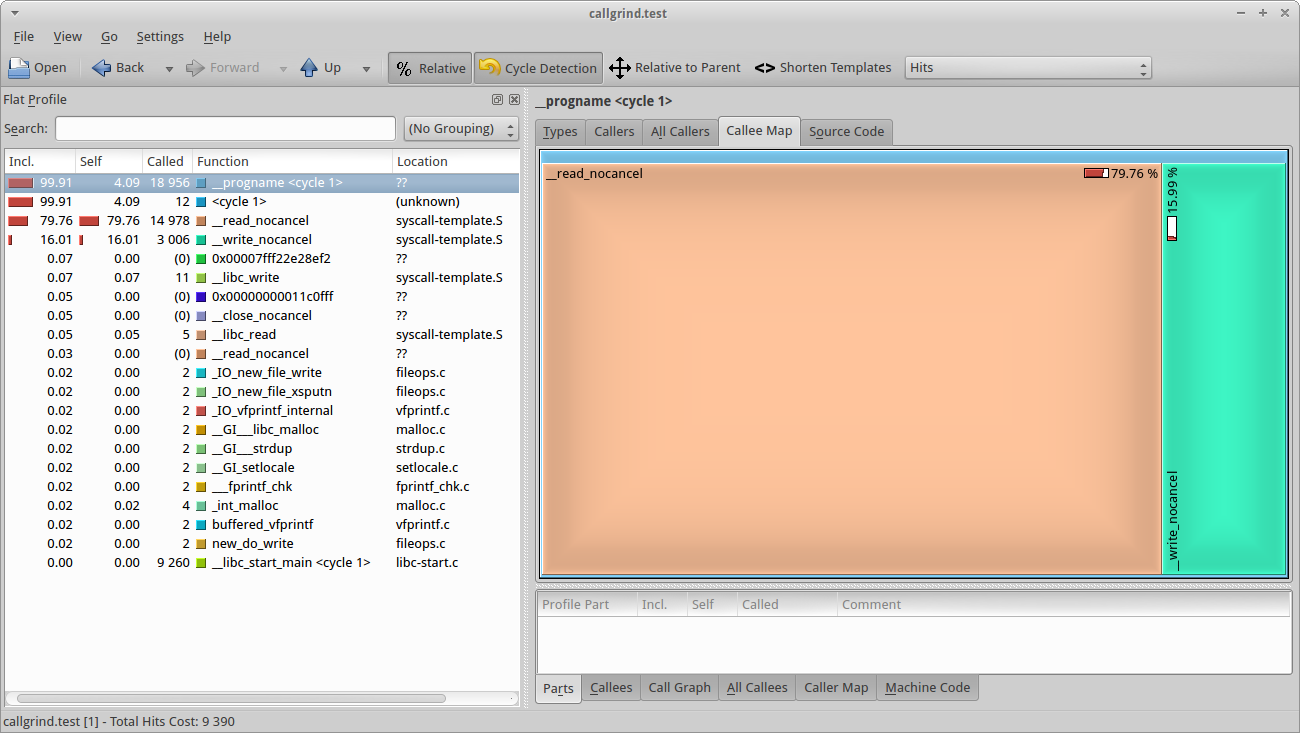
Opening the output in kcachegrind provids a very nice visualization:

This visualization makes it very obvious where the program is spending its time. In this case, it is spending almost 80% of its time reading data, and less than 16% of its time writing data (writing to /dev/null is 5x faster than reading from /dev/zero? I had no idea…). There’s also ~4% of overhead in the main loop.
The callgrind visualization of the nullfs case looks very different:

Here, we’re spending over 94% of our time writing data. That little brown strip to the right is the time we spend reading data, which is only 2.24% of the time.
With that said, this test doesn’t really tell us anything we didn’t already know after running the initial dd benchmark — nullfs writes are way slower than /dev/null writes. Why is that?
Profiling nullfs
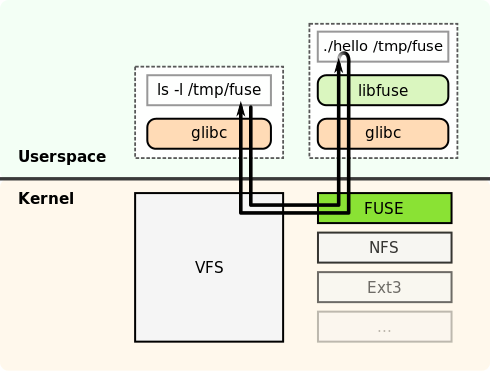
To understand why nullfs writes are so slow, you need to first understand how FUSE works. This architecture diagram from the Wikipedia is pretty good:

When dd calls write(), that write basically goes through the kernel until it is picked up by the nullfs daemon, which runs in userspace. As such, the next logical place to profile would be the nullfs daemon. This is a little trickier than the dd case for a couple of reasons.
First, for security reasons, the profiler doesn’t work with setuid executables. In this case, there’s a very simple workaround: run the nullfs daemon as root.
Second, nullfs is multithreaded. On my system at least (Linux 3.2.0), the profiler only looks at the main thread. All the main thread does is wait on a semaphore until the program exits, which isn’t very useful.
If you want to profile anything other than the main thread, you need to add profiling code to your application. In this case, I’m interested in what the FUSE worker threads are doing. As such, I added the following code to fuse_do_work():
static void *fuse_do_work(void *data)
{
    struct fuse_worker *w = (struct fuse_worker *) data;
    struct fuse_mt *mt = w->mt;
    int numiter=0;

    ProfilerStart("/tmp/dowork.txt");
    ProfilerRegisterThread();

    while (!fuse_session_exited(mt->se)) {
    	...
    	if (numiter++ == 50000)
          ProfilerStop();
    }
    ...
}
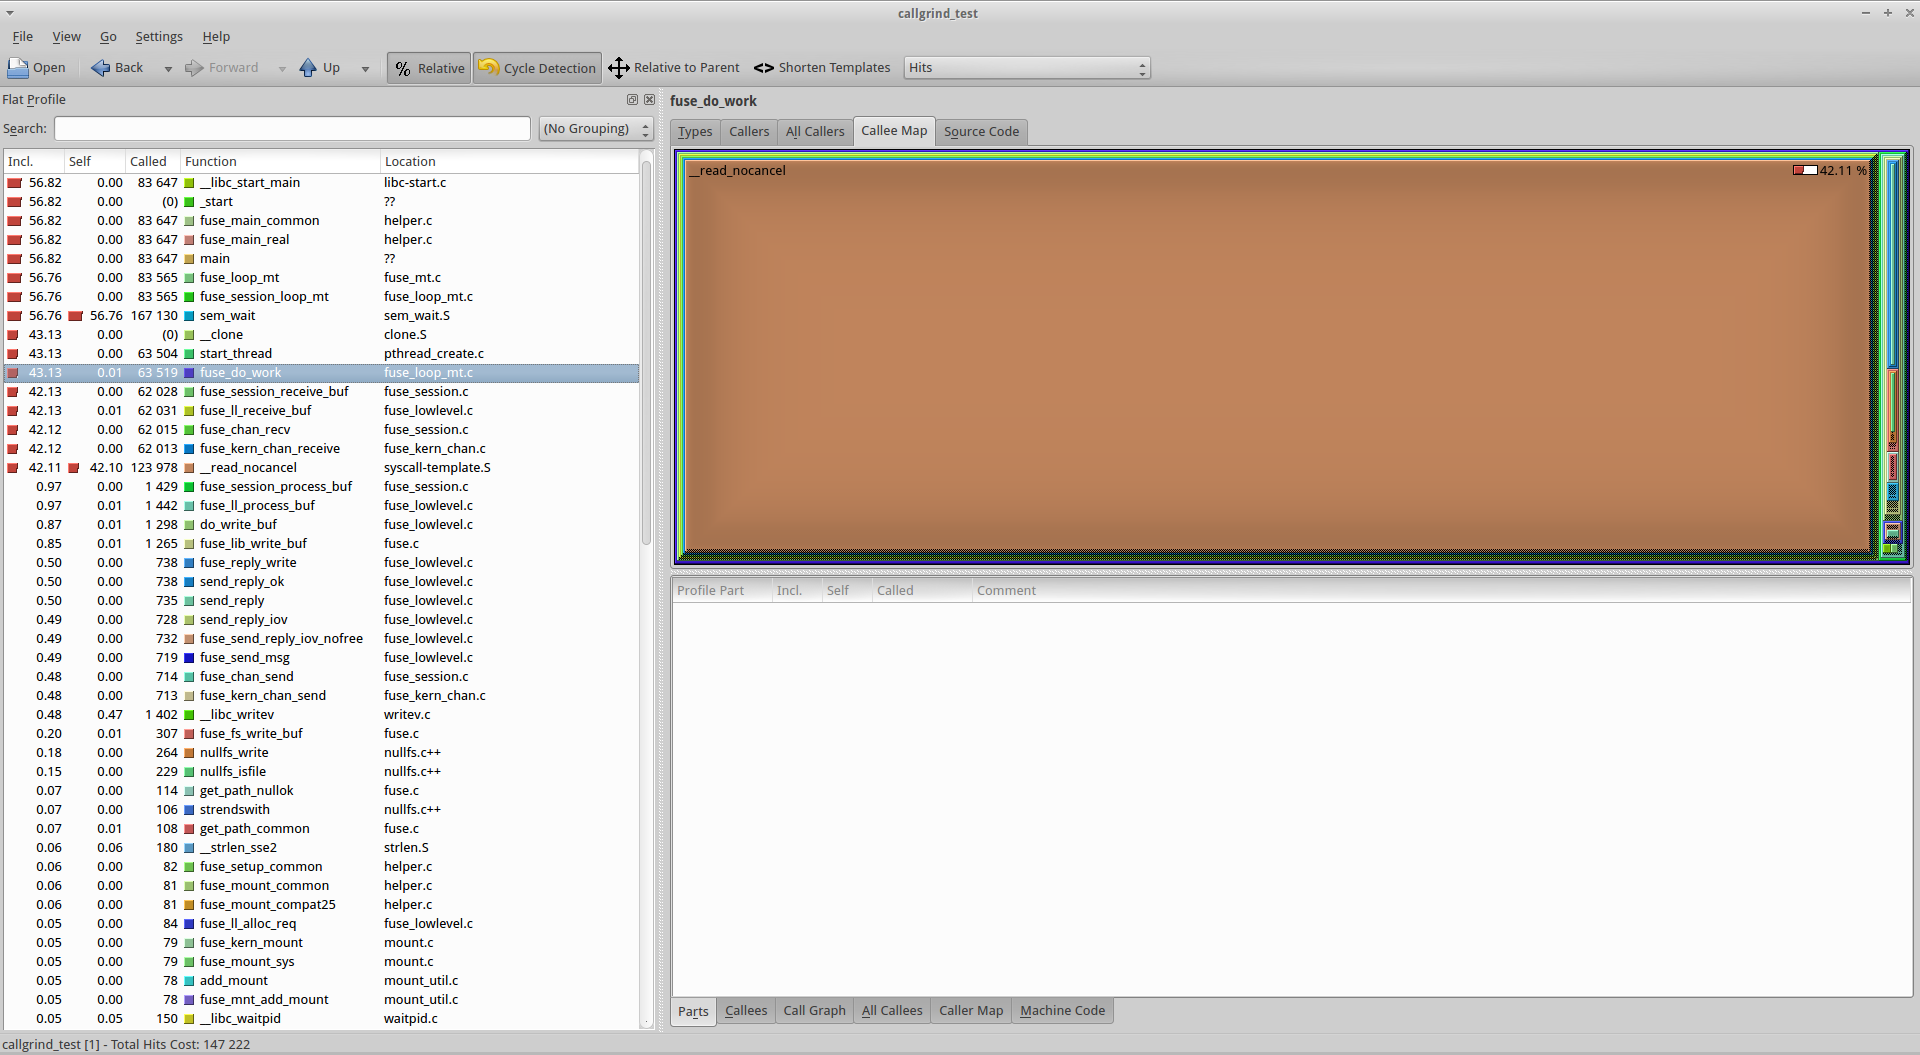
This gave me a view of what was happening in both the main thread and the worker threads:

Here, you can see that the worker thread is spending the vast majority of its time in fuse_session_receive_buf, which is waiting on __read_nocancel. All of the nullfs code that I was thinking about optimizing is actually in fuse_session_process_buf, which we are not spending very much time in.
Basically, this test shows that the reason nullfs is so slow is because it is spending a lot of time in __read_nocancel, which is basically the call that interfaces libfuse with the kernel. I’m not sure why this call is taking so much time — I guess pushing the write request from user space->kernel space->user space is slow, but I don’t understand why. If I were super motivated, I could spend some time profiling the implementation of FUSE in the kernel, but I think I’ll save that for another day. If you’re interested, decent high level overviews of what is happening in the kernel can be found here and here.
Realtime Profilers vs CPU-time Profilers
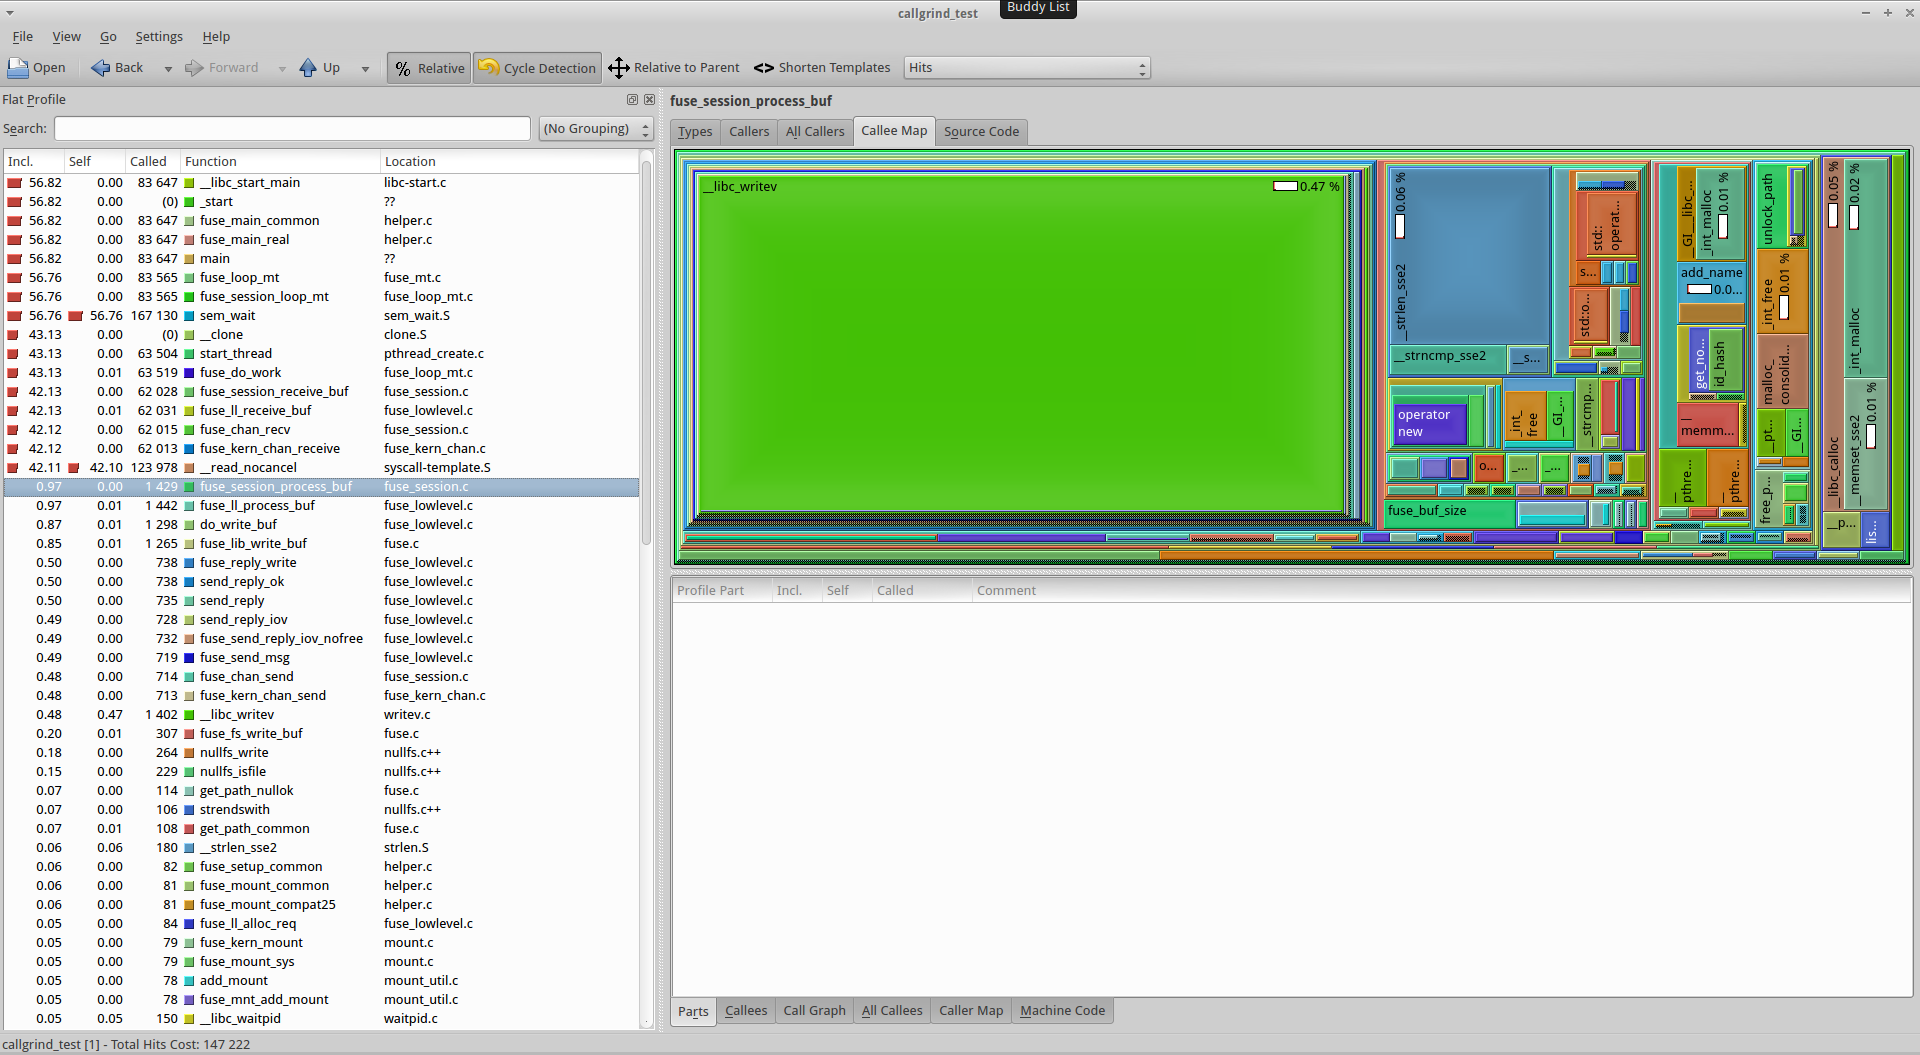
One last thing I wanted to show was the difference between what a traditional CPU-time based profiler will show you and what a realtime profiler will show you. One of my favorite profilers is callgrind, a Valgrind extension that profiles your application by basically capturing every CPU instruction. According to callgrind, this is how fuse_session_process_buf() is spending its time:

A decent chunk of time is being spent in a lot of different functions, and while there is likely room for optimization, there isn’t going to be a magic silver bullet that gets you a massive performance increase. However, if you look at the gproftools CPU profiler output, a totally different picture emerges:

This alternate perspective provides two insights that the CPU-time profiler couldn’t:
- fuse_session_process_buf() spends roughly half its time writing a response back to the original application in fuse_kern_chan_send(). Even though the callgrind output includes every instruction that was executed, there is no indication that we’re spending most of our time in fuse_kern_chan_send(). In fact, callgrind says FUSE is only spending 4.79% of its instructions there.
- Callgrind says FUSE is spending almost 85% of its CPU instructions in fuse_session_process_buf(), which is true, but it’s actually only spending roughly 2% its time there. (The profiler is reporting 0.97%, but since the samples are distributed between the primary thread and secondary thread, ~2% is more accurate)
Conclusion
This technique is incredibly powerful. Traditional profilers can usually only help you if the CPU is the bottleneck, which is of course useful, but only represents a subset of performance related issues. As far as I know, no other tool can give you this kind of insight into I/O-related performance problems. In fact, this technique probably has other applications, such as profiling applications with lock contention.
 Blog
Blog